Why Do Property Managers Struggle With Financial Visibility?
Most concierge and building management teams still rely on spreadsheets stitched together from payroll exports, time-clock CSVs, and manually entered contract values. A 2024 survey by AppFolio found that 62% of property management firms spend more than five hours per week compiling operational reports. That time adds up fast when you manage dozens of sites.
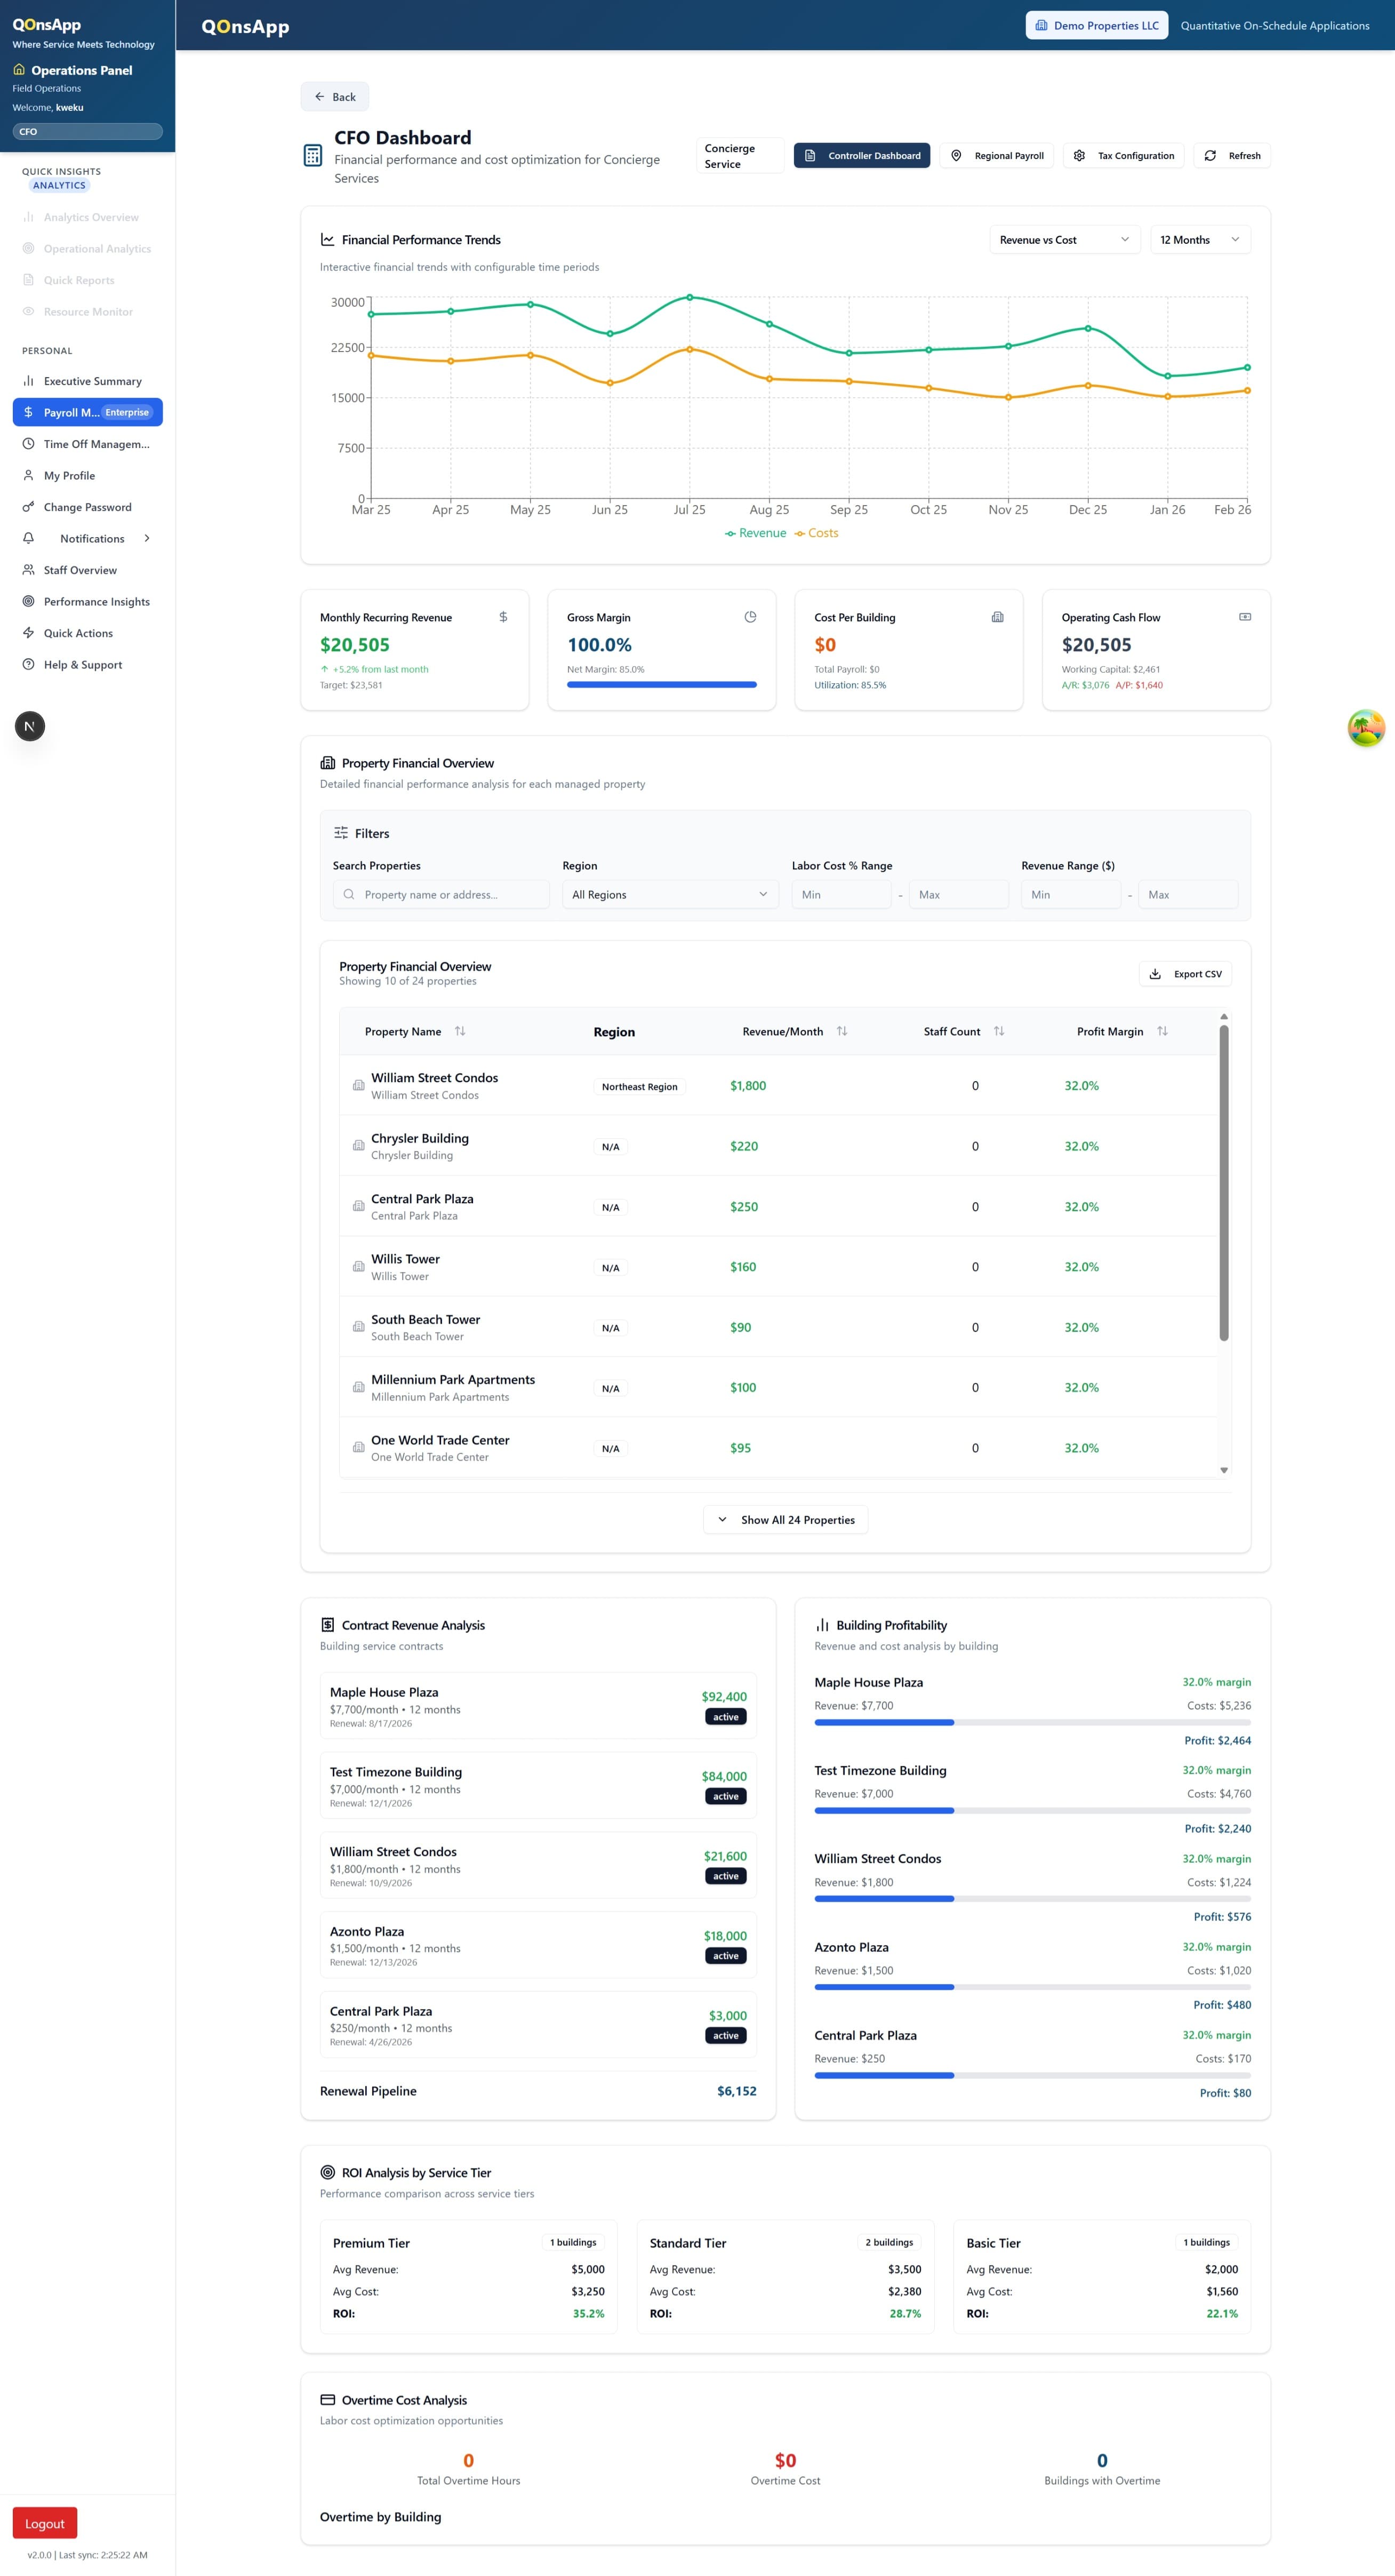
Without a single property management analytics dashboard, executives can't answer basic questions: which buildings are profitable, where overtime is spiking, or how staff utilization compares across regions. QonsApp solves that by pulling live data from scheduling, payroll, and contract modules into one unified view.
What Does the Dashboard Track?
Six core modules give controllers and CFOs the numbers they need without waiting for month-end close. Every metric updates in real time as shifts are logged and invoices are processed.
Workforce Utilization Rate
See the ratio of billable hours to total scheduled hours per building, region, or company-wide. Spot under-staffed sites and over-staffed lobbies before they hit your margin.
Building Profitability Analysis
Compare contract revenue against labor cost, supplies, and overhead for each property. Drill into individual buildings to find which accounts are margin-positive and which need renegotiation.
Overtime and Labor Cost Trends
Track overtime hours and cost as a percentage of total labor spend. Weekly trend lines help you catch patterns early, so you can adjust schedules instead of absorbing the hit.
Multi-Property Comparison
Rank buildings side by side on any KPI — cost per square foot, incidents per shift, or average response time. Filterable by region, portfolio, or client account for fast executive review.
Automated Executive Reports
Generate board-ready PDF and Excel reports on a schedule or on demand. Reports include cover summaries, charts, and drill-down tables — no copy-pasting from three different systems.
Threshold Alerts and Anomalies
Set custom alerts when utilization drops below target, overtime exceeds a budget cap, or a building flips from profitable to loss-making. Notifications arrive by email or in-app.
Need scheduling tools that feed accurate data into these reports? See how AI-powered scheduling eliminates manual shift entry.
How It Works
Three steps separate you from a property management analytics dashboard that actually reflects reality — not last month's spreadsheet.
Connect Your Data Sources
QonsApp pulls from its own scheduling, time-clock, and payroll integration modules automatically. No CSV uploads, no API keys to manage. If you already run operations through QonsApp, the analytics layer is ready from day one.
Configure KPIs and Thresholds
Choose the metrics that matter to your leadership team. Set target utilization rates, budget caps for overtime, and profitability thresholds per building. The dashboard adapts to your portfolio structure — whether that's five buildings or five hundred.
Review, Share, and Act
Open the executive dashboard for a live snapshot or schedule automated reports for your board. Compare properties on the multi-property dashboard, drill into anomalies, and reassign resources before small problems become costly ones.
Who Benefits Most From Executive Analytics?
Different roles need different slices of the same data. QonsApp surfaces the right view for each stakeholder without building separate reports.
CFOs and Controllers
Monitor labor cost as a percentage of revenue, track margin trends across the portfolio, and export board-ready financials without waiting on ops teams to reconcile spreadsheets.
Regional Directors
Compare buildings in your region on utilization, overtime, and incident frequency. Identify which site supervisors are consistently outperforming — and where additional support is needed.
Operations VPs
Get a single view of workforce deployment across every property. Spot coverage gaps, redistribute staff between sites, and validate that scheduling decisions are translating into measurable efficiency gains.
Frequently Asked Questions
How quickly does data appear on the dashboard?
Metrics update within minutes of shift check-ins, payroll syncs, and invoice entries. There's no overnight batch process. If a staff member clocks in at 7:00 AM, their hours are reflected in utilization calculations by 7:05 AM.
Can I restrict dashboard access by role?
Yes. QonsApp uses role-based access control with 47 distinct roles. Controllers see financial summaries. Regional directors see only their assigned buildings. Supervisors see their own site metrics. Every view is filtered by the user's permissions automatically.
Does it integrate with our existing accounting software?
QonsApp exports reports in Excel and PDF formats compatible with major accounting platforms. Direct integrations with payroll providers are handled through the payroll integration module, keeping labor cost data accurate and up to date.
What happens if I manage fewer than ten properties?
The analytics dashboard works for portfolios of any size. Even single-building operators benefit from utilization tracking and automated reporting. The multi-property comparison features become more valuable as your portfolio grows, but the core financial metrics are useful from day one.